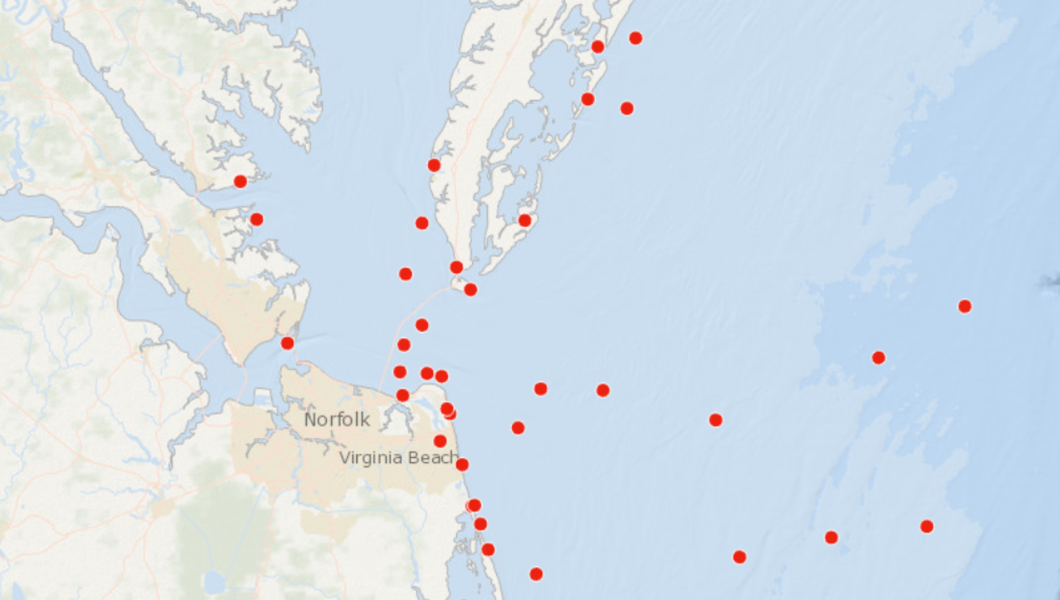
The Mid-Atlantic Ocean Data Portal has published a series of new maps charting the locations of marine mammal stranding events reported over the course of two decades from Virginia to Maine. The maps were created with data maintained by the National Oceanic and Atmospheric Administration (NOAA) Marine Mammal Health and Stranding Response Program and gathered by members of the U.S. National Marine Mammal Stranding Network.

The maps, which can be accessed in the Portal’s Marine Life theme, depict information recorded by stranding network responders between 2000 and 2020 through a process known as Level A data collection. Scientists and natural resource managers use the information to help promote the conservation of marine mammal species, as well as to respond to and mitigate threats to marine mammal populations. Individual stranding events are documented, providing important insight into natural history, life history, and the health of species. Long-term data collection allows for the analysis of trends, and informs conservation and management efforts.

The new map layers on the Portal include:
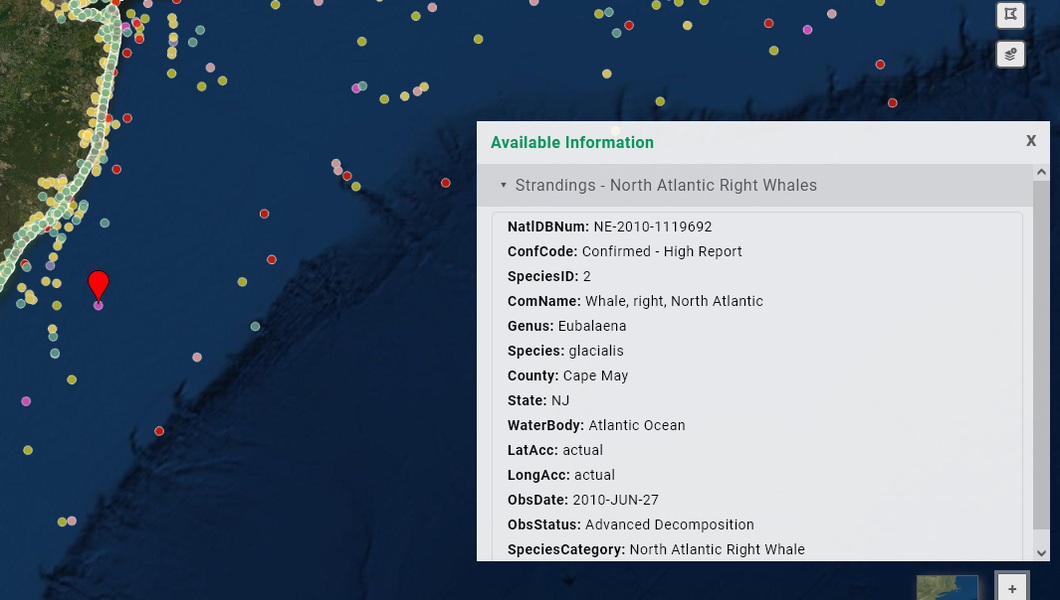
● Marine Mammal Strandings by Species/Group: Users can activate any combination of seven map layers showing sites where strandings were reported for North Atlantic right whales, humpback whales, dolphins, porpoises, seals, other whales, and unidentified marine mammals.
● Marine Mammal Strandings by Season: These four maps depict where stranding events for all marine mammal types were reported in the winter, spring, summer and fall. Users can activate them one at a time or view data for multiple seasons at once.
● Marine Mammal Strandings County Summaries: This map provides the number of overall stranding events reported by county. Orange circle icons floating over each county are sized commensurate with the number of strandings.

When displaying any of the species/group or seasonal map layers, Portal users can click on any point for a pop-up containing information collected by responders, such as the animal’s species, observed condition, the incident date and report number. The maps do not provide information on the cause of death in mortality events. Further information on particular stranding events may be obtained by contacting the stranding network organization that responded.
More Marine Mammal Data on the Portal

Users can explore hundreds of additional maps on the Portal for information about marine mammal distributions and habitats in the region. The Marine Life theme contains a “Marine Mammals” dropdown with maps that model the total abundance, core abundance areas, and species richness for eight groups of cetaceans that belong to common biological groups or address key management needs (e.g. All Cetaceans, Baleen Whales, Sound Sensitivity Low Frequency). Users can also view maps of monthly and annual distributions for 30 species of marine mammals in the Marine Life Library (Species Specific) theme. Many of these products were updated in the spring.
The Maritime theme contains a North Atlantic Right Whale Seasonal Management Areas layer showing zones where speed limits are enforced for large vessels at certain times of year to reduce the likelihood of deaths and serious injuries to these endangered whales that result from collisions with ships. The map is maintained by the NOAA Fisheries Greater Atlantic Region Fisheries Office.
In collaboration with the NOAA Northeast Fisheries Science Center Passive Acoustic Research Program and the Regional Wildlife Science Entity (RWSE), the Portal added six maps in the fall to represent the components of a proposed Passive Acoustic Monitoring (PAM) design for regional long-term monitoring of whales in North and Mid-Atlantic offshore lease areas and wind energy areas.
Questions or comments? Email portal@midatlanticocean.org.

